RSI & Backed-Weighted MA StrategyRSI & MA Strategy :
INTRODUCTION :
This strategy is based on two well-known indicators that work best together: the Relative Strength Index (RSI) and the Moving Average (MA). We're going to use the RSI as a trend-follower indicator, rather than a reversal indicator as most are used to. To the signals sent by the RSI, we'll add a condition on the chart's MA, filtering out irrelevant signals and considerably increasing our winning rate. This is a medium/long-term strategy. There's also a money management method enabling us to reinvest part of the profits or reduce the size of orders in the event of substantial losses.
RSI :
The RSI is one of the best-known and most widely used indicators in trading. Its purpose is to warn traders when an asset is overbought or oversold. It was designed to send reversal signals, but we're going to use it as a trend indicator by increasing its length to 20. The RSI formula is as follows :
RSI (n) = 100 - (100 / (1 + (H (n)/L (n))))
With n the length of the RSI, H(n) the average of days closing above the open and L(n) the average of days closing below the open.
MA :
The Moving Average is also widely used in technical analysis, to smooth out variations in an asset. The SMA formula is as follows :
SMA (n) = (P1 + P2 + ... + Pn) / n
where n is the length of the MA.
However, an SMA does not weight any of its terms, which means that the price 10 days ago has the same importance as the price 2 days ago or today's price... That's why in this strategy we use a RWMA, i.e. a back-weighted moving average. It weights old prices more heavily than new ones. This will enable us to limit the impact of short-term variations and focus on the trend that was dominating. The RWMA used weights :
The 4 most recent terms by : 100 / (4+(n-4)*1.30)
The other oldest terms by : weight_4_first_term*1.30
So the older terms are weighted 1.30 more than the more recent ones. The moving average thus traces a trend that accentuates past values and limits the noise of short-term variations.
PARAMETERS :
RSI Length : Lenght of RSI. Default is 20.
MA Type : Choice between a SMA or a RWMA which permits to minimize the impact of short term reversal. Default is RWMA.
MA Length : Length of the selected MA. Default is 19.
RSI Long Signal : Minimum value of RSI to send a LONG signal. Default is 60.
RSI Short signal : Maximum value of RSI to send a SHORT signal. Default is 40.
ROC MA Long Signal : Maximum value of Rate of Change MA to send a LONG signal. Default is 0.
ROC MA Short signal : Minimum value of Rate of Change MA to send a SHORT signal. Default is 0.
TP activation in multiple of ATR : Threshold value to trigger trailing stop Take Profit. This threshold is calculated as multiple of the ATR (Average True Range). Default value is 5 meaning that to trigger the trailing TP the price need to move 5*ATR in the right direction.
Trailing TP in percentage : Percentage value of trailing Take Profit. This Trailing TP follows the profit if it increases, remaining selected percentage below it, but stops if the profit decreases. Default is 3%.
Fixed Ratio : This is the amount of gain or loss at which the order quantity is changed. Default is 400, which means that for each $400 gain or loss, the order size is increased or decreased by a user-selected amount.
Increasing Order Amount : This is the amount to be added to or subtracted from orders when the fixed ratio is reached. The default is $200, which means that for every $400 gain, $200 is reinvested in the strategy. On the other hand, for every $400 loss, the order size is reduced by $200.
Initial capital : $1000
Fees : Interactive Broker fees apply to this strategy. They are set at 0.18% of the trade value.
Slippage : 3 ticks or $0.03 per trade. Corresponds to the latency time between the moment the signal is received and the moment the order is executed by the broker.
Important : A bot has been used to test the different parameters and determine which ones maximize return while limiting drawdown. This strategy is the most optimal on BITSTAMP:ETHUSD with a timeframe set to 6h. Parameters are set as follows :
MA type: RWMA
MA Length: 19
RSI Long Signal: >60
RSI Short Signal : <40
ROC MA Long Signal : <0
ROC MA Short Signal : >0
TP Activation in multiple ATR : 5
Trailing TP in percentage : 3
ENTER RULES :
The principle is very simple:
If the asset is overbought after a bear market, we are LONG.
If the asset is oversold after a bull market, we are SHORT.
We have defined a bear market as follows : Rate of Change (20) RWMA < 0
We have defined a bull market as follows : Rate of Change (20) RWMA > 0
The Rate of Change is calculated using this formula : (RWMA/RWMA(20) - 1)*100
Overbought is defined as follows : RSI > 60
Oversold is defined as follows : RSI < 40
LONG CONDITION :
RSI > 60 and (RWMA/RWMA(20) - 1)*100 < -1
SHORT CONDITION :
RSI < 40 and (RWMA/RWMA(20) - 1)*100 > 1
EXIT RULES FOR WINNING TRADE :
We have a trailing TP allowing us to exit once the price has reached the "TP Activation in multiple ATR" parameter, i.e. 5*ATR by default in the profit direction. TP trailing is triggered at this point, not limiting our gains, and securing our profits at 3% below this trigger threshold.
Remember that the True Range is : maximum(H-L, H-C(1), C-L(1))
with C : Close, H : High, L : Low
The Average True Range is therefore the average of these TRs over a length defined by default in the strategy, i.e. 20.
RISK MANAGEMENT :
This strategy may incur losses. The method for limiting losses is to set a Stop Loss equal to 3*ATR. This means that if the price moves against our position and reaches three times the ATR, we exit with a loss.
Sometimes the ATR can result in a SL set below 10% of the trade value, which is not acceptable. In this case, we set the SL at 10%, limiting losses to a maximum of 10%.
MONEY MANAGEMENT :
The fixed ratio method was used to manage our gains and losses. For each gain of an amount equal to the value of the fixed ratio, we increase the order size by a value defined by the user in the "Increasing order amount" parameter. Similarly, each time we lose an amount equal to the value of the fixed ratio, we decrease the order size by the same user-defined value. This strategy increases both performance and drawdown.
Enjoy the strategy and don't forget to take the trade :)
Search in scripts for "Relative Strength Index (RSI) "

Volatility Adjusted Composite RSI with SMA and EMA SignalsOverview
The script "VAC - RSI with SMA and EMA Signals" combines the traditional Relative Strength Index (RSI) with Time-based RSI (T-RSI), and adjusts it for volatility to create a Composite RSI (C-RSI). The script further uses Simple Moving Average (SMA) and Exponential Moving Average (EMA) to generate signals for potential trading opportunities. In the "VAC - RSI with SMA and EMA Signals" script, the combination of price, time, and volatility works as follows:
Price: The script calculates the traditional RSI based on price changes over a specified period.
Time: Alongside the price-based RSI, a Time-based RSI (T-RSI) is calculated, which considers the number of upward and downward closes over the same period.
Volatility: Volatility is integrated into the Composite RSI (C-RSI) by adjusting it with a Z-score based on a standard deviation of closing prices.
These three factors work together to create a more holistic and robust indicator.
How can it be used?
This script is used to identify potential overbought and oversold conditions in the market. It plots the VAC-RSI, SMA, and EMA on a chart, along with overbought and oversold levels, providing visual signals to the trader. When the EMA is below the SMA, it is a bullish signal, and vice versa for a bearish signal.
Default Values for Different Inputs:
Price RSI Weightage (%): 65
Unified Period for RSI & T-RSI: 14
C-RSI SMA Period: 13
C-RSI EMA Period: 33
C-RSI Bull Trend Support: 35
C-RSI Bear Trend Resistance: 65
Use Volatility Adjusted C-RSI (VAC-RSI): true
Standard Deviation Period: 14
Volatility Scaling Factor (α): 5
These values can be adjusted according to the trading strategy to optimize the signals for different assets or timeframes.
Strategies this Can be Used for:
The script can be used in various trading strategies including:
Trend Following: By observing the crosses of EMA and SMA, traders can follow the trend.
Reversion to the Mean: Using the overbought and oversold levels to identify potential reversal points.
Breakout: Identifying breakout points using the Bull and Bear Market Support and Resistance levels.
Comparison with the Standard Indicator:
Enhanced Sensitivity to Market Conditions
Improved Signal Quality
Versatility
Volatility Adjustment
Interpretation of Output Values:
VAC-RSI Value:
The script provides additional overbought (80) and oversold (20) lines to help identify extreme conditions.
SMA and EMA Values:
When the EMA is below the SMA, it is generally considered a bullish signal.
When the EMA is above the SMA, it is generally considered a bearish signal.
The cross of EMA and SMA can be used as a trigger for entry or exit points.
Bull and Bear Market Support and Resistance Lines:
The Bull Market VAC-RSI Support (default at 35) and Bear Market VAC-RSI Resistance (default at 65) lines can be used to identify potential breakout or breakdown points.
In a bull market, if the VAC-RSI stays above the support line, it indicates a strong uptrend.
In a bear market, if the VAC-RSI stays below the resistance line, it indicates a strong downtrend.

Pro RSI CalculatorThe "Pro RSI Calculator" indicator is the latest addition to a series of custom trading tools that includes the "Pro Supertrend Calculator" and the "Pro Momentum Calculator."
Building upon this series, the "Pro RSI Calculator" is designed to provide traders with further insights into market trends by leveraging the Relative Strength Index (RSI) indicator.
Its primary objective remains consistent: to analyze historical price data and make informed predictions about future price movements, with a specific focus on identifying potential bullish (green) or bearish (red) candlestick patterns.
1. RSI Calculation:
The indicator begins by computing the RSI, a widely used momentum oscillator. It calculates two crucial RSI parameters:
RSI Length: This parameter determines the lookback period for RSI calculations.
RSI Upper and Lower Bands: These thresholds define overbought and oversold conditions, typically set at 70 and 30, respectively.
2. RSI Bands Visualization:
The RSI values obtained from the calculation are skillfully plotted on the price chart, appearing as two distinct lines:
Red Line: Represents the RSI when indicating a bearish trend, anticipating potential price declines.
Teal Line: Represents the RSI in bullish market conditions, signaling the possibility of price increases.
3. Consecutive Candlestick Analysis:
The indicator's core functionality revolves around tracking consecutive candlestick patterns based on their relationship with the RSI lines.
To be included in the analysis, a candlestick must consistently close either above (green candles) or below (red candles) the RSI lines for multiple consecutive periods.
4. Labeling and Enumeration:
To communicate the count of consecutive candles displaying consistent trend behavior, the indicator meticulously assigns labels to the price chart.
Label positioning varies depending on the trend's direction, appearing either below (for bullish patterns) or above (for bearish patterns) the candlesticks.
The color scheme aligns with the candle colors: green labels for bullish candles and red labels for bearish ones.
5. Tabular Data Presentation:
The indicator enhances its graphical analysis with a customizable table that prominently displays comprehensive statistical insights.
Key data points in the table include:
- Consecutive Candles: The count of consecutive candles displaying consistent trend characteristics.
- Candles Above Upper RSI: The number of candles closing above the upper RSI threshold during the consecutive period.
- Candles Below Lower RSI: The number of candles closing below the lower RSI threshold during the consecutive period.
- Upcoming Green Candle: An estimated probability of the next candlestick being bullish, derived from historical data.
- Upcoming Red Candle: An estimated probability of the next candlestick being bearish, also based on historical data.
6. Custom Configuration:
To cater to various trading strategies and preferences, the indicator offers extensive customization options.
Traders can fine-tune parameters like RSI length, upper, and lower bands, label and table placement, and table size to align with their unique trading approaches.

Divergance Based on Vortex IndicatorThe Vortex-Based Divergence Indicator represents a groundbreaking approach to analyzing market dynamics within the realm of technical analysis. Drawing inspiration from the concept of vortices and their cyclical patterns, this indicator strives to illuminate potential divergence points within financial markets, providing traders with valuable insights for informed decision-making.
At its foundation, the Vortex-Based Divergence Indicator builds upon the principles of the Vortex Indicator, a well-established tool for gauging momentum and identifying potential trend reversals. However, this innovative indicator goes a step further by focusing on the divergences that can occur between the Vortex Indicator and the actual price movements.
Divergences, which arise when the direction of an indicator's movement contradicts the direction of price action, hold paramount significance within the Vortex-Based Divergence Indicator. By integrating this indicator with other renowned oscillators, such as the Relative Strength Index (RSI) or the Moving Average Convergence Divergence (MACD), traders can augment their analytical capabilities significantly.
These complementary oscillators can corroborate or validate the signals generated by the Vortex-Based Divergence Indicator. For instance, when the Vortex-Based Divergence Indicator hints at a potential trend reversal, cross-referencing this insight with the RSI's overbought or oversold levels can enhance the accuracy of the prediction. Likewise, employing the MACD to confirm momentum shifts in conjunction with the Vortex Indicator's signals can provide a more comprehensive view of market dynamics.
It's crucial to emphasize the importance of synergy when combining these indicators. Rather than relying solely on the Vortex-Based Divergence Indicator, incorporating other oscillators acts as a checks-and-balances system, reducing false signals and enhancing the overall reliability of the trading strategy. However, prudent traders also recognize that no indicator or combination thereof is foolproof. Additional factors, such as fundamental analysis and market news, should also be considered to achieve well-rounded trading decisions.
In essence, the Vortex-Based Divergence Indicator's integration with established oscillators like RSI and MACD offers traders a powerful toolkit to navigate complex market landscapes. By leveraging the strengths of each indicator and cross-referencing their insights, traders can elevate their trading strategies to new heights of accuracy and effectiveness.

Market trend based on ema strengthThis script is a trading indicator written in Pine Script, a domain-specific language used for creating custom technical analysis indicators and strategies on the TradingView platform. Let's break down what this script is doing and its potential usage:
Title and Overlay:
The indicator is given a title: "Market trend based on ema strength."
The overlay=true parameter ensures that the indicator is plotted on the price chart itself, overlaying the price data.
EMA Calculations:
Exponential Moving Averages (EMAs) are calculated for different time periods based on the closing prices.
Degree of Change Calculation:
The degree of change is calculated as the percentage difference between the closing price and each respective EMAs.
Trend Identification:
The script attempts to identify uptrends and downtrends based on the comparison of degree of change values across the different EMAs. For an uptrend, each subsequent EMA's degree of change should be greater than the previous one, and for a downtrend, it should be lower.
EMA and RSI Calculation:
Additional EMAs and the Relative Strength Index (RSI) are calculated.
Buy and Sell Signal Generation:
Buy signals are generated when certain conditions are met: an uptrend is detected, the previous close is below the additional EMAs, and the current close is above the additional EMAs.
Sell signals are generated in the opposite scenario: a downtrend is detected, the previous close is above the additional EMAs, and the current close is below the additional EMAs.
Visualization:
The script uses plotshape to visually indicate buy and sell signals on the chart as labels.
The background color of the chart is changed based on the detected trend
Usage:
This indicator is designed to assist traders in identifying potential buy and sell signals based on trends in EMAs, RSI, and price movement. It provides a visual representation of trend changes and generates signals when certain conditions align, helping traders make informed decisions about entering or exiting positions.
It's important to note that while this script provides an automated approach to identifying trends and generating signals, successful trading also requires a deep understanding of the market, risk management, and the application of multiple indicators and strategies. Traders should thoroughly backtest and validate any trading strategy before applying it in real trading scenarios.

RSI Supreme Multi-Method [MyTradingCoder]Introducing the "RSI Supreme Multi-Method" indicator, a powerful tool that combines the Relative Strength Index (RSI) with selectable manipulation methods to identify overbought and oversold conditions in the market, along with the ability to detect divergences for enhanced trading insights.
The indicator features four distinct manipulation methods for the RSI, each providing valuable insights into market conditions:
1. Standard RSI Method: The indicator uses the traditional RSI calculation to identify overbought and oversold areas.
2. Volatility Weighted RSI Method: This method applies a volatility formula to the RSI calculation, allowing for a more responsive indication of market conditions during periods of heightened volatility. Users can adjust the length of the volatility formula to fine-tune this method.
3. Smoothed RSI Method: The smoothed RSI method utilizes a smoothing algorithm to reduce noise in the RSI values, presenting a clearer representation of overbought and oversold conditions. The length of the smoothing can be adjusted to match your trading preferences.
4. Session Weighted RSI Method: With this innovative method, users can specify multipliers for different time sessions throughout the day to manipulate the base RSI. Each session can be customized with start and end times, enabling or disabling specific sessions, and specifying the multiplier for each session. This feature allows traders to adapt the RSI to different market sessions dynamically.
Additionally, the "RSI Supreme Multi-Method" indicator draws divergences on the oscillator, providing an extra layer of analysis for traders. Divergences occur when the direction of the RSI differs from the direction of the price movement, potentially signaling trend reversals.
Key Settings:
RSI Length: Adjust the length of the base RSI before applying any manipulation.
RSI Source: Determine the data source for the base RSI calculation.
Overbought Value: Set the RSI value at which overbought conditions are indicated.
Oversold Value: Set the RSI value at which oversold conditions are indicated.
RSI Type: Choose from four options: Standard, Smoothed, Volatility Manipulated, or Session Manipulated.
Volatility Manipulated Settings: Adjust the length of the volatility formula (applicable to Volatility Manipulated method).
Smoothed Settings: Adjust the length of the smoothing (applicable to Smoothed method).
Session Manipulated Settings: Customize six different time sessions with start and end times, enable or disable specific sessions, and specify multipliers for each session.
Divergence Color: Adjust the color of the drawn divergences to suit your chart's aesthetics.
Divergence Tuning: Fine-tune the sensitivity of the divergence detection for more accurate signals.
The "RSI Supreme Multi-Method" indicator is a versatile and comprehensive tool that can be used to identify overbought and oversold areas, as well as to spot potential trend reversals through divergences. However, like all technical analysis tools, it should be used in conjunction with other indicators and analysis methods to make well-informed trading decisions.
Enhance your trading insights with the "RSI Supreme Multi-Method" indicator and gain an edge in identifying critical market conditions and divergences with precision.

Variety Step RSI w/ Dynamic Zones [Loxx]Variety Step RSI w/ Dynamic Zones is a stepped RSI calculation with Discontinued Signal Lines. This indicator includes 7 types of RSI to choose from. The addition of the Discontinued Signal Lines allows this indicator to better identify momentum shifts in price so traders have better defined long/short signals.
Enhanced Moving Average Calculation with Stepped Moving Average and the Advantages over Regular RSI
Technical analysis plays a crucial role in understanding and predicting market trends. One popular indicator used by traders and analysts is the Relative Strength Index (RSI). However, an enhanced approach called Stepped Moving Average, in combination with the Slow RSI function, offers several advantages over regular RSI calculations.
█ Stepped Moving Average and Moving Averages:
The Stepped Moving Average function serves as a crucial component in the calculation of moving averages. Moving averages smooth out price data over a specific period to identify trends and potential trading signals. By employing the Stepped Moving Average function, traders can enhance the accuracy of moving averages and make more informed decisions.
Stepped Moving Average takes two parameters:
The current RSI value and a size parameter. It computes the next step in the moving average calculation by determining the upper and lower bounds of the moving average range. It accomplishes this by adjusting the values of smax and smin based on the given RSI and size.
Furthermore, Stepped Moving Average introduces the concept of a trend variable. By comparing the previous trend value with the current RSI and the previous upper and lower bounds, it updates the trend accordingly. This feature enables traders to identify potential shifts in market sentiment and make timely adjustments to their trading strategies.
█ Advantages over Regular RSI:
Enhanced Range Boundaries:
The inclusion of size parameters in Stepped Moving Average allows for more precise determination of the upper and lower bounds of the moving average range. This feature provides traders with a clearer understanding of the potential price levels that can influence market behavior. Consequently, it aids in setting more effective entry and exit points for trades.
Improved Trend Identification:
The trend variable in Stepped Moving Average helps traders identify changes in market trends more accurately. By considering the previous trend value and comparing it to the current RSI and previous bounds, Stepped Moving Average captures trend reversals with greater precision. This capability empowers traders to respond swiftly to market shifts and potentially capture more profitable trading opportunities.
Smoother Moving Averages:
Stepped Moving Average's ability to adjust the moving average range bounds based on trend changes and size parameters results in smoother moving averages. Regular RSI calculations may produce jagged or erratic results due to abrupt market movements. Stepped Moving Average mitigates this issue by dynamically adapting the range boundaries, thereby providing traders with more reliable and consistent moving average signals.
Complementary Functionality with Slow RSI:
Stepped Moving Average and Slow RSI function in harmony to provide a comprehensive trading analysis toolkit. While Stepped Moving Average refines the moving average calculation process, Slow RSI offers a more accurate representation of market strength. The combination of these two functions facilitates a deeper understanding of market dynamics and assists traders in making better-informed decisions.
What is a Discontinued Signal Line (DSL)?
Many indicators employ signal lines to more easily identify trends or desired states of the indicator. The concept of a signal line is straightforward: by comparing a value to its smoothed, slightly lagging state, one can determine the current momentum or state.
The Discontinued Signal Line builds on this fundamental idea by extending it: rather than having a single signal line, multiple lines are used based on the indicator's current value.
The "signal" line is calculated as follows:
When a specific level is crossed in the desired direction, the EMA of that value is calculated for the intended signal line.
When that level is crossed in the opposite direction, the previous "signal" line value is "inherited," becoming a sort of level.
This approach combines signal lines and levels, aiming to integrate the advantages of both methods.
In essence, DSL enhances the signal line concept by inheriting the previous signal line's value and converting it into a level.
Extras
-Alerts
-Signals
Related indicators:
Step RSI

RSI Xray + VolumeRSI Analysis:
The indicator calculates the Relative Strength Index (RSI) using a user-defined length (default: 14).
It colors the bars based on RSI levels to identify potential overbought and oversold conditions.
Bars exceeding the overbought level (default: 70) are colored, while bars below the oversold level (default: 30) are colored too.
This helps traders identify potential trend reversals or market exhaustion points.
Midpoint Analysis:
The indicator calculates the midpoint of each bar, which is the average of the high and low prices.
It colors the bars based on their relation to the midpoint.
Bars above the midpoint are colored, indicating potential bullish momentum.
Bars below the midpoint are colored, suggesting potential bearish momentum.
Volume Analysis:
The indicator offers the ability to analyze volume changes and identify high volume bars.
It colors the bars when the volume exceeds a user-defined threshold.
This feature helps traders identify potential areas of market interest and increased participation.
Moving Average (SMA):
The indicator plots a Simple Moving Average (SMA) line of the closing price over a user-defined period (default: 9).
This moving average line helps traders identify potential trends and spot areas of support or resistance.
RSI Extreme Conditions:
The indicator identifies extreme RSI conditions by comparing the current RSI value with the highest and lowest RSI values calculated from a user-defined number of previous bars (default: 10).
When the RSI exceeds the overbought level but is lower than the highest RSI value within the specified range, the bar color changes to a customizable color (default: blue).
Conversely, when the RSI falls below the oversold level but is higher than the lowest RSI value within the specified range, the bar color changes to the same customizable color.
This feature helps traders identify potential RSI-based trading opportunities and market turning points.
Customization:
The indicator offers customizable settings for colors, RSI levels, SMA length, volume thresholds, RSI extreme levels, and RSI label color.
Traders can modify these settings based on their preferences and trading strategies.
Overall, the 'RSI Xray + Volume' indicator provides a comprehensive view of RSI levels, market momentum, volume changes, and RSI extreme conditions. Traders can use this information to identify potential trade setups, validate market trends, and make more informed trading decisions. It can be applied to various timeframes and instruments, making it a valuable tool for both short-term and long-term traders.
Triple RSI Indicator with ToggleThis script combines three relative strength index (RSI) indicators with different periods, and allows the user to toggle between them to generate overbought and oversold signals. The indicator is named "Triple RSI Indicator with Toggle" and has the short title "TRSI-T."
The input parameters for the RSI periods are set by the user and include a short RSI with a period of 5, a main RSI with a period of 14, and a long RSI with a period of 28. The overbought and oversold levels for each RSI can also be set by the user.
The script plots the three RSI lines on the chart and calculates a bar color based on the enabled RSI values. If all three RSI values are overbought, the bar color is set to fuchsia, if all three RSI values are oversold, the bar color is set to aqua, and if neither of these conditions is met, the bar color is set to not available.
The script also includes a fast RSI and an RSI exponential moving average (EMA) with adjustable periods. The RSI fast line is plotted along with the RSI EMA line, and a cloud fill is generated between the two lines. The fill color is based on whether the fast RSI line is above or below the RSI EMA line, with a blue color used for long signals and a pink color used for short signals.
This indicator can be used as part of a trading strategy in a number of ways. Here are a few examples:
Overbought and Oversold Signals: When the bar color of the indicator is fuchsia, it indicates that all three RSIs are overbought, and when the bar color is aqua, it indicates that all three RSIs are oversold. These signals can be used to enter a trade in the opposite direction, anticipating a reversal in price.
RSI Divergence: Traders can also look for divergences between the price and the RSI values. For example, if the price is making higher highs but the RSI values are making lower highs, it could indicate that the price trend is weakening and a reversal may be imminent. Conversely, if the price is making lower lows but the RSI values are making higher lows, it could indicate that the price trend is about to reverse.
RSI Cloud Signals: The cloud fill generated between the fast RSI and RSI EMA lines can be used to generate trading signals. When the fast RSI line is above the RSI EMA line and the fill color is blue, it can be a signal to go long. When the fast RSI line is below the RSI EMA line and the fill color is pink, it can be a signal to go short.
If anybody has some interesting thoughts on how to improve it, let me know!!
RSI Overbought/Oversold + Divergence IndicatorDESCRIPTION:
This script combines the Relative Strength Index ( RSI ), Moving Average and Divergence indicator to make a better decision when to enter or exit a trade.
- The Moving Average line (MA) has been made hidden by default but enhanced with an RSIMA cloud.
- When the RSI is above the selected MA it turns into green and when the RSI is below the select MA it turns into red.
- When the RSI is moving into the Overbought or Oversold area, some highlighted areas will appear.
- When some divergences or hidden divergences are detected an extra indication will be highlighted.
- When the divergence appear in the Overbought or Oversold area the more weight it give to make a decision.
- The same color pallet has been used as the default candlestick colors so it looks familiar.
HOW TO USE:
The prerequisite is that we have some knowledge about the Elliot Wave Theory, the Fibonacci Retracement and the Fibonacci Extension tools.
Wave 1
(1) When we receive some buy signals we wait until we receive some extra indications.
(2) On the RSI Overbought/Oversold + Divergence Indicator we can see a Bullish Divergence and our RSI is changing from red to green ( RSI is higher then the MA).
(3) If we are getting here into the trade then we need to use a stop loss. We put our stop loss 1 a 2 pips just below the lowest wick. We also invest maximum 50% of the total amount we want to invest.
Wave 2
(4) Now we wait until we see a clear reversal and here we starting to use the Fibonacci Retracement tool. We draw a line from the lowest point of wave(1) till the highest point of wave (1). When we are retraced till the 0.618 fib also called the golden ratio we check again the RSI Overbought/Oversold + Divergence Indicator. When we see a reversal we do our second buy. We set again a stop loss just below the lowest wick (this is the yellow line on the chart). We also move the stop loss we have set in step (3) to this level.
Wave 3
(5) To identify how far the uptrend can go we need to use the Fibonacci Extension tool. We draw a line from the lowest point of wave(1) till the highest point of wave (1) and draw it back to the lowest point of wave (2). Wave (3) is most of the time the longest wave and can go till it has reached the 1.618 or 2.618 fib. On the 1.618 we can take some profit. If we don't want to sell we move our stop loss to the 1 fib line (yellow line on the chart).
(6) We wait until we see a clear reversal on the Overbought/Oversold + Divergence Indicator and sell 33% to 50% of our investment.
Wave 4
(7) Now we wait again until we see a clear reversal and here we starting to use the Fibonacci Retracement tool. We draw a line from the lowest point of wave(2) till the highest point of wave (3). When we are retraced till the 0.618 fib also called the golden ratio we check again the RSI Overbought/Oversold + Divergence Indicator. When we see a reversal we buy again. We set again a stop loss just below the lowest wick (this is the yellow line on the chart).
(8) If we bought at the first reversal ours stop los was triggered (9) and we got out of the trade.
(9) If we did not bought at step (7) because our candle did not hit the 0.618 fib or we got stopped out of the trade we buy again at the reversal.
Wave 5
(10) To identify how far the uptrend can go we need to use the Fibonacci Extension tool. We draw a line from the lowest point of wave(2) till the highest point of wave (3) and draw it back to the lowest point of wave (4). Most of the time wave 5 goes up till it has reached the 1 fib. And that is the point where we got out of the trade with all of our investment. In this trade we got out of the trade a bit earlier. We received the sell signals and got a reversal on the Overbought/Oversold + Divergence Indicator.
We are hoping you learned something so you can make better decisions when to get into or out of a trade.
If you have any question just drop it into the comments below.
FEATURES:
• You can show/hide the RSI .
• You can show/hide the MA.
• You can show/hide the lRSIMA cloud.
• You can show/hide the Stoch RSI cloud.
• You can show/hide and adjust the Overbought and Oversold zones.
• You can show/hide and adjust the Overbought Extended and Oversold Extended zones.
• You can show/hide the Overbought and Oversold highlighted zones.
• Etc...
HOW TO GET ACCESS TO THE SCRIPT:
• Favorite the script and add it to your chart.
REMARKS:
• This advice is NOT financial advice.
• We do not provide personal investment advice and we are not a qualified licensed investment advisor.
• All information found here, including any ideas, opinions, views, predictions, forecasts, commentaries, suggestions, or stock picks, expressed or implied herein, are for informational, entertainment or educational purposes only and should not be construed as personal investment advice.
• We will not and cannot be held liable for any actions you take as a result of anything you read here.
• We only provide this information to help you make a better decision.
• While the information provided is believed to be accurate, it may include errors or inaccuracies.
Good Luck and have fun,
The CryptoSignalScanner Team

MTF Stoch RSI + Realtime DivergencesMulti-timeframe Stochastic RSI + Realtime Divergences + Alerts + Pivot lookback periods.
This version of the Stochastic RSI adds the following additional features to the stock UO by Tradingview:
- Optional 3 x Multiple-timeframe overbought and oversold signals, indicating where 3 selected timeframes are all overbought (>80) or all oversold (<20) at the same time, with alert option.
- Optional divergence lines drawn directly onto the oscillator in realtime, with alert options.
- Configurable lookback periods to fine tune the divergences drawn in order to suit different trading styles and timeframes, including the ability to enable automatic adjustment of pivot period per chart timeframe.
- Alternate timeframe feature allows you to configure the oscillator to use data from a different timeframe than the chart it is loaded on.
- Indications where the Stoch RSI is crossing down from above the overbought threshold (<80) and crossing above the oversold threshold (>20) levels on a given user selected timeframe, by printing gold dots on the indicator.
- Also includes standard configurable Stoch RSI options, including k length, d length, RSI length, Stochastic length, and source type (close, hl2, etc)
While this version of the Stochastic RSI has the ability to draw divergences in realtime along with related settings and alerts so you can be notified as divergences occur without spending all day watching the charts, the main purpose of this indicator was to provide the triple multiple-timeframe overbought and oversold confluence signals and alerts, in an attempt to add more confluence, weight and reliability to the single timeframe overbought and oversold states, commonly used for trade entry confluence. It's primary purpose is intended for scalping on lower timeframes, typically between 1-15 minutes. The triple timeframe overbought can often indicate near term reversals to the downside, with the triple timeframe oversold often indicating neartime reversals to the upside. The default timeframes for this confluence are set to check the 1 minute, 5 minute, and 15 minute timeframes, ideal for scalping the < 15 minute charts.
The Stochastic RSI
The popular oscillator has been described as follows:
“The Stochastic RSI is an indicator used in technical analysis that ranges between zero and one (or zero and 100 on some charting platforms) and is created by applying the Stochastic oscillator formula to a set of relative strength index (RSI) values rather than to standard price data. Using RSI values within the Stochastic formula gives traders an idea of whether the current RSI value is overbought or oversold. The Stochastic RSI oscillator was developed to take advantage of both momentum indicators in order to create a more sensitive indicator that is attuned to a specific security's historical performance rather than a generalized analysis of price change.”
How do traders use overbought and oversold levels in their trading?
The oversold level, that is when the Stochastic RSI is above the 80 level is typically interpreted as being 'overbought', and below the 20 level is typically considered 'oversold'. Traders will often use the Stochastic RSI at an overbought level as a confluence for entry into a short position, and the Stochastic RSI at an oversold level as a confluence for an entry into a long position. These levels do not mean that price will necessarily reverse at those levels in a reliable way, however. This is why this version of the Stoch RSI employs the triple timeframe overbought and oversold confluence, in an attempt to add a more confluence and reliability to this usage of the Stoch RSI.
What are divergences?
Divergence is when the price of an asset is moving in the opposite direction of a technical indicator, such as an oscillator, or is moving contrary to other data. Divergence warns that the current price trend may be weakening, and in some cases may lead to the price changing direction.
There are 4 main types of divergence, which are split into 2 categories;
regular divergences and hidden divergences. Regular divergences indicate possible trend reversals, and hidden divergences indicate possible trend continuation.
Regular bullish divergence: An indication of a potential trend reversal, from the current downtrend, to an uptrend.
Regular bearish divergence: An indication of a potential trend reversal, from the current uptrend, to a downtrend.
Hidden bullish divergence: An indication of a potential uptrend continuation.
Hidden bearish divergence: An indication of a potential downtrend continuation.
Setting alerts.
With this indicator you can set alerts to notify you when any/all of the above types of divergences occur, on any chart timeframe you choose, and also when the triple timeframe overbought and oversold confluences occur.
Configurable pivot lookback values.
You can adjust the default pivot lookback values to suit your prefered trading style and timeframe. If you like to trade a shorter time frame, lowering the default lookback values will make the divergences drawn more sensitive to short term price action. By default, this indicator has enabled the automatic adjustment of the pivot periods for 4 configurable timeframes, in a bid to optimise the divergences drawn when the indicator is loaded onto any of the 4 timeframes. These timeframes and the auto adjusted pivot periods on each of them can also be reconfigured within the settings menu.
How do traders use divergences in their trading?
A divergence is considered a leading indicator in technical analysis , meaning it has the ability to indicate a potential price move in the short term future.
Hidden bullish and hidden bearish divergences, which indicate a potential continuation of the current trend are sometimes considered a good place for traders to begin, since trend continuation occurs more frequently than reversals, or trend changes.
When trading regular bullish divergences and regular bearish divergences, which are indications of a trend reversal, the probability of it doing so may increase when these occur at a strong support or resistance level . A common mistake new traders make is to get into a regular divergence trade too early, assuming it will immediately reverse, but these can continue to form for some time before the trend eventually changes, by using forms of support or resistance as an added confluence, such as when price reaches a moving average, the success rate when trading these patterns may increase.
Typically, traders will manually draw lines across the swing highs and swing lows of both the price chart and the oscillator to see whether they appear to present a divergence, this indicator will draw them for you, quickly and clearly, and can notify you when they occur.
Disclaimer: This script includes code from the stock UO by Tradingview as well as the Divergence for Many Indicators v4 by LonesomeTheBlue.

RSI + MA StrategyHello, everyone!
We have just released an innovative strategy for TradingView. It allows you to facilitate the trading process when you have to use both indicators.
This strategy is:
User-friendly
Configurable
Equipped with the combination of Relative Strength Index (RSI) and Moving Average (MA) indicators
Designed with all required functions to manage positions
Features
The RSI+MA strategy can:
Identify entry points for Long and Short positions.
Depict RSI and MA values concerning each other.
Reduce visual congestion and import usability thanks to using a combo of 2 indicators.
Allow using pivot trading. The RSI+MA strategy will enter a Long position according to the Short position conditions. And vice versa.
Note! If you want to open a Long position, the RSI line should cross MA from top to bottom. If you want to open a Short position, RSI has to cross MA from bottom to top.
Parameters
We have equipped our strategy with more than 14 additional parameters. So, you can configure the EA according to your needs!
Inputs :
Use Reverse Trade — allows swapping Long and Short positions opening conditions.
Resolution — allows you to view an indicator with data on a higher or lower timeframe on the current chart.
RSI Length
RSI Source: Open, High, Low, Close, HL2, HLC3, OHLC4
Show MA — allows you to enable or disable MA displaying.
MA Length
MA Offset
Style:
RSI — RSI indicator line color and style settings.
MA — MA indicator line color and style configuration.
Upper Band — allows customizing line style, color, and RSI upper bound value.
Lower Band — allows you to customize line style, color, and RSI lower bound value.
Background — background color setting within the RSI upper and lower borders.
Precision — number of decimals for RSI values.
Note! Try RSI+MA on your demo account first before going live.

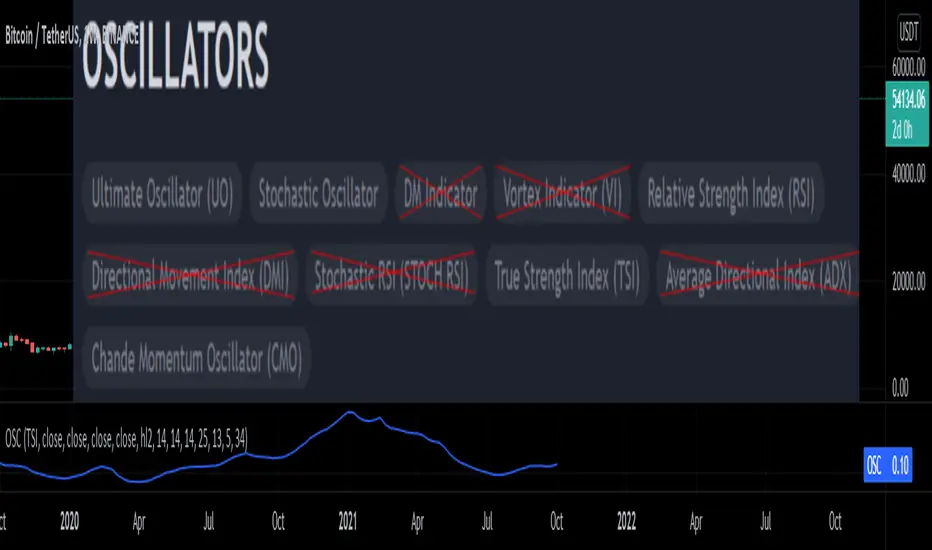
Oscillators SwitchSwitch for common oscillator. Uses built-in function from Pine Script v5 such as Chande Momentum Oscillator (CMO), Relative Strength Index (RSI), Stochastic (STO), True Strength Index (TSI) and Ultimate Oscillator (UO).
Oscillator available as below :
Input displayed individually :
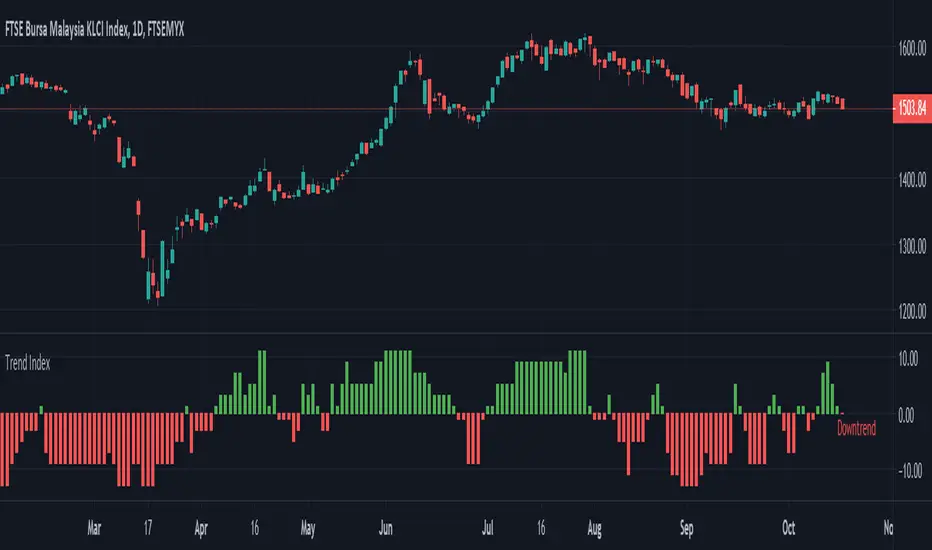
Trend Index Trend Index show trend of the instrument based on multiple indicators
- Green --> Uptrend
- Red --> Downtrend
- Gray --> No trend
Indicators used:-
Relative Strength Index (RSI)
Commodity Channel Index (CCI)
William Percent Range (WPR)
Directional Movement Index (DMI)
Elder Force Index (EFI)
Momentum
Demarker
Parabolic SAR
Congestion Index by KatsanosCONGESTION INDEX
Market movements can be characterized by two distinct types or phases. In the first, the market shows trending movements which have a directional bias over a period of time. The second type of market behavior is periodic or cyclic motion, where the market shows no consistent directional bias and trades between two levels. This type of market results in the failure of trend-following indicators and the success of overbought/oversold oscillators. Both phases of the market require the use of different types of indicator. Trending markets need trend-following indicators such as moving averages, moving average convergence/divergence (MACD), and so on. Trading range markets need oscillators such as the relative strength index (RSI) and stochastics, which use overbought and oversold levels. The age-old problem for many trading systems is their inability to determine if a trending or trading range market is at hand. Trend-following indicators, such as the MACD or moving averages, tend to be whipsawed as markets enter a nontrending congestion phase. On the other hand, oscillators (which work well during trading range markets) are often too early to buy or sell in a trending market. Thus, identifying the market phase and selecting the appropriate indicators is critical to a system’s success. The congestion index attempts to identify the market’s character by dividing the actual percentage that the market has changed in the past x days by the extreme range according to the following formula:
Readings between+20 and−20indicate congestion or oscillating mode. Crossing over the 20 line from below indicates the start of a rising trend. Conversely, the start of a down turn is indicated by crossing under−20 from above. The CI can also be used as an overbought/oversold oscillator.
It was taken from İntermarket Trading Strategies book of by Markos Katsanos.Read the book.
D1:=Input(“DAYS IN CONGESTION”,1,500,15);
CI:=ROC(C,D1-1,%)/((HHV(H,D1)-LLV(L,D1))/(LLV(L,D1)+.01)+.000001);
Mov ( CI ,3,E)
(Copyright Markos Katsanos 2008)

cd_RSI_Divergence_CxGeneral:
The Relative Strength Index (RSI) is a momentum oscillator widely used by traders in price analysis. In addition to showing overbought/oversold zones, divergences between RSI and price are also tracked to identify trading opportunities.
The general consensus is that oscillators alone are not sufficient for entries and should be evaluated together with multiple confirmations.
This oscillator is designed as an additional confirmation/compatible tool for strategies that already use higher time frame (HTF) sweeps and lower time frame (LTF) confirmations such as Change in State Delivery (CISD) or Change of Character (CHOCH).
Features:
While RSI oscillators are commonly displayed in line format (classic), this indicator also offers candlestick-style visualization.
Depending on the selected source, period length, and EMA length, RSI can be displayed as lines and/or candlesticks.
Divergence detection & tracking:
Price and RSI values are monitored on the chosen higher time frame (from the menu) to determine highs and lows. For divergence display, the user can choose between two modes:
1- Alignment with HTF Sweep
2- All
1 - Alignment with HTF Sweep:
First, the price must sweep the previous high/low of the candle on the HTF (i.e., break it) but fail to continue in that direction and return inside (sweep).
If this condition is met, RSI values are checked:
If price makes a high sweep but RSI fails to make a new high → divergence is confirmed.
If price makes a low sweep but RSI fails to make a new low → divergence is confirmed.
Divergence is then displayed on the chart.
2 - All:
In this mode, sweep conditions are ignored. Divergence is confirmed if:
Price makes a new high on HTF but RSI does not.
RSI makes a new high on HTF but price does not.
Price makes a new low on HTF but RSI does not.
RSI makes a new low on HTF but price does not.
Menu & Settings:
RSI visualization (source + period length + EMA period length)
Option to choose classic/candlestick style display
Color customization
Higher time frame selection
Adjustable HTF boxes and table display
Final notes:
This oscillator is designed as an additional confirmation tool for strategies based on HTF sweep + LTF CISD/CHOCH confirmation logic. The chosen HTF in the oscillator should match the time frame where sweeps are expected.
Divergence signals from this oscillator alone will not make you profitable.
For spot trades, monitoring sweeps and divergences on higher time frames is more suitable (e.g., Daily–H1 / Weekly–H4).
My personal usage preferences:
Entry TF: 3m
HTF bias: Daily + H1
Sweep + CISD: 30m / 3m
Market Structure: 3m
RSI divergence: HTF = 30m
If all of them align bullish or bearish ( timeframe alignment ), I try to take the trade.
I’d be glad to hear your feedback and suggestions for improvement.
Happy trading!

Momentum DivergenceOverview
The Momentum Divergence Oscillator is a valuable tool designed for traders who are familiar with basic charting but want to deepen their market insights. This indicator combines a momentum calculation with divergence detection, presenting the data in an intuitive way with a blue momentum line and colored divergence signals ("Bull" and "Bear"). It’s perfect for refining entry and exit points across various timeframes, especially for scalping or swing trading strategies.
Understanding the Concepts
What is Momentum?
Momentum measures the speed and strength of a price movement by comparing the current closing price to a previous close over a set period. In this indicator, it’s calculated as the difference between the current close and the close from a user-defined number of bars ago (default: 10). A rising momentum line indicates accelerating upward momentum, while a falling line suggests slowing momentum or a potential reversal. This helps you gauge whether a trend is gaining power or losing steam, making it a key indicator for spotting overbought or oversold conditions.
What is a Divergence?
A divergence occurs when the price action and the momentum indicator move in opposite directions, often signaling a potential trend reversal. The Momentum Divergence Oscillator highlights two types:
Bullish Divergence: When the price forms a lower low (indicating weakness), but the momentum shows a higher low (suggesting underlying strength). This can foreshadow an upward reversal.
Bearish Divergence: When the price reaches a higher high (showing strength), but the momentum records a lower high (indicating fading momentum). This may hint at an impending downward turn.
How the Indicator Works
The indicator plots a momentum line in a separate pane below your chart, giving you a clear view of price momentum over time. It also scans for divergences using adjustable lookback periods (default: 5 bars left and right) and a range window (default: 5-60 bars) to ensure relevance. When a divergence is detected, it’s visually highlighted, and you can customize the sensitivity through input settings like the momentum length and pivot lookback. Alerts are included to notify you of new divergence signals in real-time, saving you from constant monitoring.
How to Apply It
Identifying Opportunities: Use bullish divergences ("Bull") as a cue to consider long positions, especially when confirmed by support levels or a moving average crossover. Bearish divergences ("Bear") can signal short opportunities, particularly near resistance zones.
Combining with Other Tools: Pair this oscillator with indicators like the Relative Strength Index (RSI) or volume analysis to filter out false signals and increase confidence in your trades. For example, a bullish divergence with rising volume can be a stronger buy signal.
Timeframe Flexibility: Test it on shorter timeframes (e.g., 5-minute charts) for quick scalping trades or longer ones (e.g., 1-hour or 4-hour charts) for swing trading, adjusting the momentum length to suit the market’s pace.
Alert Setup: Enable the built-in alerts to get notified when a divergence forms, allowing you to react promptly without staring at the screen all day.
Strategy Example
Spot a bullish divergence on a 15-minute chart where the price hits a lower low, but the momentum rises.
Confirm with a break above a 20-period EMA and increasing volume.
Enter a long position with a stop-loss below the recent low and a take-profit near the next resistance level.
Customization Tips
Adjust the "Momentum Length" (default: 10) to make the oscillator more or less sensitive—shorter lengths react faster, while longer ones smooth out noise.
Tweak the "Pivot Lookback" settings to widen or narrow the divergence detection range based on your trading style.
Use the "Range Upper/Lower" inputs to focus on divergences within a specific timeframe that matches your strategy.
Important Considerations
b]This indicator is a technical analysis tool, not a guaranteed trading system. Always pair it with a solid strategy and strict risk management, such as setting stop-losses.
In strong trending markets, divergences can sometimes produce false signals. Consider adding a trend filter (e.g., ADX below 25) to avoid whipsaws.
Experiment with the settings on a demo account or backtest to find what works best for your preferred markets and timeframes.

RSI and MACD Divergence IndicatorThe RSI and MACD Divergence Indicator is a custom Pine Script v6 indicator designed for TradingView that identifies and visualizes divergences between price movements and two technical indicators: the Relative Strength Index (RSI) and the Moving Average Convergence Divergence (MACD). Here's a brief explanation of its functionality:
Divergence Detection: The indicator detects both regular and hidden divergences for RSI, MACD (MACD Line), and Histogram. Regular bullish divergences occur when price makes a lower low but the indicator makes a higher low (suggesting a potential reversal upward), while regular bearish divergences occur when price makes a higher high but the indicator makes a lower high (suggesting a potential reversal downward). Hidden divergences indicate continuation patterns (e.g., higher low in price with a lower low in the indicator for bullish continuation).
Customizable Inputs:
Pivot Bars: Sets the number of bars used to confirm pivot highs and lows (default: 5).
RSI and MACD Parameters: Allows adjustment of RSI length (default: 14) and MACD settings (fast: 12, slow: 26, signal: 9).
Toggle Options: Enables/disables detection of regular and hidden divergences for RSI, MACD, and Histogram individually.
Confirmation: Option to wait for pivot confirmation (default: true), delaying divergence display until the pivot is fully formed.
Show Only Last Divergence: Toggles between showing only the most recent divergence (default: true) or all detected divergences (false), with previous lines and labels cleared when true.
Minimum Divergences: Sets the minimum number of divergence types required at a pivot to display (default: 1, max: 6).
Maximum Pivot Points: Limits the number of historical pivot points to check (default: 10).
Maximum Bars to Check: Restricts analysis to the last specified number of bars (default: 500).
Visualization:
Draws lines connecting the price pivot points where divergences are detected, with customizable colors, widths, and styles (solid, dashed, dotted) for RSI and MACD.
Displays a single label per pivot with vertically stacked text listing all detected divergence types (e.g., "RSI Bull Div\nMACD Bull Div"), using semi-transparent backgrounds (green for bullish, red for bearish) and white text.

BARTRADINGPREDV4Please note, that all of the indicators on the chart are working together. I am showing all of the indicators so that you might see the benefits of these indicators working as one. Do your own research. Trade smart. I code tools not advice. So please make decisions based on your trading style and knowledge. Use my scripts freely but please note they are protected by Mozilla.
Script Summary: BARTRADINGPREDV4
This Pine Script indicator is a comprehensive trading tool that overlays on your TradingView chart. It combines moving averages, regression channels, volume analysis, RSI filtering, and pattern recognition to assist in making trading decisions. It also provides a forward-looking projection to help anticipate future price movement.
Key Features & Logic
1. Moving Averages
HMA (High Moving Average): Simple moving average of the high price over a user-defined lookback period.
LMA (Low Moving Average): Simple moving average of the low price over the same period.
HLMA (High-Low Moving Average): The average of HMA and LMA, providing a midline reference.
2. RSI Filtering
Optionally enables a Relative Strength Index (RSI) filter to help avoid trades when the market is not trending strongly.
Only allows buy signals if RSI is above 50, and sell signals if RSI is below 50 (if enabled).
3. Signal Generation
BUY Signal: Triggered when HL2 (average of OHLC) crosses over LMA and (optionally) RSI > 50.
SELL Signal: Triggered when HL2 crosses under HMA and (optionally) RSI < 50.
XSB (Extra Strong Buy): HL2 crosses over HMA, is above HLMA, up volume is greater than down volume, and (optionally) RSI > 50.
XBS (Extra Strong Sell): HL2 crosses under LMA, is below HLMA, down volume is greater than up volume, and (optionally) RSI < 50.
Enable/Disable XSB/XBS: You can turn these signals on or off via script inputs.
4. Take Profit (TP) and Stop Loss (SL) Levels
TP and SL are dynamically calculated based on the difference between HMA and LMA, providing contextually relevant exit levels.
5. Regression Channel and Prediction
Linear Regression Line: Plots a regression line over the lookback period to show the underlying trend.
ATR Channel: Adds an upper and lower channel around the regression line using ATR (Average True Range) for a realistic prediction envelope.
Forward Projection: Projects the regression line forward by a user-defined number of bars, visually showing where the trend could extend if current momentum persists.
6. Pattern Recognition
Higher Highs/Lows and Lower Highs/Lows: Marks bars where new higher highs/lows or lower highs/lows are set, helping you spot trend continuation or reversal points.
7. Status Table
A table shows the current price’s relationship to HMA, HLMA, and LMA, color-coded for quick visual interpretation.
User Instructions
Inputs
Number of Lookback Bars: Sets the period for all moving averages and regression calculations.
Prediction Length: (Legacy; not used in current logic.)
TURN ON OR OFF XSB/XBS Signal: Toggle extra strong buy/sell signals.
Enable RSI Filter: Only allow signals when RSI is in the correct zone.
RSI Period: Sets the sensitivity of the RSI filter.
Table Position: Choose where the status table appears on your chart.
ATR Length & Multiplier: Control the width of the regression prediction channel.
Bars Forward (Projection): Number of bars to project the regression line into the future.
How to Use
Add the script to your TradingView chart.
Adjust inputs to suit your asset and timeframe.
Interpret signals:
BUY (B) and SELL (S): Appear as green/red labels below/above bars.
XSB (blue) and XBS (orange): Indicate extra strong buy/sell conditions.
HH/HL (green triangles): New higher highs/lows.
LH/LL (red triangles): New lower highs/lows.
Watch the regression channel: The yellow regression line shows the trend; the shaded band indicates expected volatility.
Check the projection: The dashed magenta line projects the regression trend forward, giving a visual target for price continuation.
Use the table: Quickly see if price is above or below each moving average.
Interpreting the Prediction Aspects
Regression Line & Channel
Regression Line (Yellow): Represents the best-fit line of price over the lookback period, showing overall trend direction.
ATR Channel: The upper and lower bands (yellow, semi-transparent) account for typical volatility, suggesting a range where price is likely to stay if the trend continues.
Forward Projection
Dashed Magenta Line: Projects the regression line forward by the specified number of bars, using the current slope. This is a trend continuation forecast—not a guarantee, but a statistically reasonable path if current conditions persist.
How to use: If price is respecting the regression trend and within the channel, the projection provides a visual target for where price might go in the near future.
TP/SL Levels
TP (Take Profit): Suggests a price target above the current HL2, based on recent volatility.
SL (Stop Loss): Suggests a protective stop below HL2.
Best Practices & Warnings
No indicator is perfect! Always combine signals with your own analysis and risk management.
Regression projection is not a crystal ball: It simply extends the current trend, which can and will change, especially after big news or at support/resistance.
Use on liquid, trending assets for best results.
Adjust lookback and ATR settings for your market and timeframe.
Summary Table Example
Price vs HMA vs HLMA vs LMA
43000 +100 +50 -20
Green: Price is above average (bullish).
Red: Price is below average (bearish).
Yellow: Price is very close to the average (neutral).
Final Notes
This script is designed to be a multi-tool for trend trading and prediction, combining classic and modern techniques. The forward projection helps visualize possible future price action, while signals and overlays keep you informed of trend shifts and trade opportunities.

RSI Multi-TF TabRSI Multi-Timeframe Table 📊
A tool for multi-timeframe RSI analysis with visual overbought/oversold level highlighting.
Description
This indicator calculates the Relative Strength Index (RSI) for the current chart and displays RSI values across five additional timeframes (15m, 1h, 4h, 1d, 1w) in a dynamic table. The color-coded system simplifies identifying overbought (>70), oversold (<30), and neutral zones. Visual signals on the chart enhance analysis for the current timeframe.
Key Features
✅ Multi-Timeframe Analysis :
Track RSI across 15m, 1h, 4h, 1d, and 1w in a compact table.
Color-coded alerts:
🔴 Red — Overbought (potential pullback),
🔵 Blue — Oversold (potential rebound),
🟡 Yellow — Neutral zone.
✅ Visual Signals :
Background shading for oversold/overbought zones on the main chart.
Horizontal lines at 30 and 70 levels for reference.
✅ Customizable Settings :
Adjust RSI length (default: 14), source (close, open, high, etc.), and threshold levels.
How to Use
Table Analysis :
Compare RSI values across timeframes to spot divergences (e.g., overbought on 15m vs. oversold on D).
Use colors for quick decisions.
Chart Signals :
Blue background suggests bullish potential (oversold), red hints at bearish pressure (overbought).
Always confirm with other tools (volume, trends, or candlestick patterns).
Examples :
RSI(1h) > 70 while RSI(4h) < 30 → Possible reversal upward.
Sustained RSI(1d) above 50 may indicate a bullish trend.
Settings
RSI Length : Period for RSI calculation (default: 14).
RSI Source : Data source (close, open, high, low, hl2, hlc3, ohlc4).
Overbought/Oversold Levels : Thresholds for alerts (default: 70/30).
Important Notes
No direct trading signals : Use this as an analytical tool, not a standalone strategy.
Test strategies historically and consider market context before trading.

Reversal Trap Sniper – Verified VersionReversal Trap Sniper
Overview
Reversal Trap Sniper is a counterintuitive momentum-following strategy that identifies "reversal traps"—situations where traders expect a market reversal based on RSI, but the price continues trending. By detecting these failed reversal signals, the strategy enters trades in the trend direction, often catching strong follow-through moves.
How It Works
The system monitors the Relative Strength Index (RSI). When RSI moves above the overbought level (e.g., 70) and then drops back below it, many traders interpret this as a sell signal.
However, this strategy treats such moves with caution. If the RSI pulls back below the overbought threshold but the price continues to rise, the system considers it a "reversal trap"—a fakeout.
In such cases, instead of going short, the strategy enters a long position, assuming that the trend is still valid and those betting on a reversal may fuel a breakout.
Similarly, if RSI rises above the oversold level from below, but price continues falling, a short trade is triggered.
Entries are followed by ATR-based stop-loss and dynamic take-profit (2× risk), with a fallback time-based exit after 30 bars.
Key Features
- Detects failed RSI-based reversals ("traps")
- Follows momentum after the trap is triggered
- Uses ATR for dynamic stop-loss and take-profit
- Auto-exit after a fixed bar count (30 bars)
- Visual markers on chart for transparency
- Realistic trading assumptions: 0.05% commission, slippage, and capped pyramiding
Parameter Explanation
RSI Length (14): Standard RSI calculation period
Overbought/Oversold Levels (70/30): Common thresholds used by many traders
ATR Length (14): Used to define stop-loss and target dynamically
Risk-Reward Ratio (2.0): Take-profit is set at 2× the stop-loss distance
Max Holding Bars (30): Ensures trades don’t remain open indefinitely
Pyramiding (10): Allows scaling into trades, simulating real-world strategy stacking
Originality Note
This strategy inverts traditional RSI logic. Instead of treating overbought/oversold conditions as signals for reversal, it waits for those signals to fail. Only after such failures, confirmed by continued price action in the same direction, does the system enter trades. This logic is based on the behavioral observation that failed reversal signals often trigger stronger trend continuation—making this strategy uniquely positioned to exploit trap scenarios.
Disclaimer
This script is for educational and research purposes only. Trading involves risk, and past performance does not guarantee future results. Always test thoroughly before applying with live capital.

Adaptive Multi-TF Indicator Table with Presets giua64📌 Script Name:
Adaptive Multi-Timeframe Indicator Table with Presets — giua64
📄 Description:
This script displays an adaptive multi-timeframe dashboard that summarizes the signals of three key technical indicators:
Moving Averages (MAs), Relative Strength Index (RSI), and MACD.
It provides a fast and visually intuitive overview of market conditions across five timeframes (5m, 15m, 30m, 1h, 4h), helping traders quickly identify potential directional biases (e.g., bullish, bearish, or neutral) based on either predefined presets or fully manual settings.
🧰 Preset Configurations:
You can choose between four trading styles, each with optimized indicator parameters:
Scalping
• MAs: 5 / 10 (Fast), 20 / 50 (Slow)
• RSI: 7 periods | Overbought: 70 | Oversold: 30
• MACD: 5 / 13 | Signal: 3
Intraday
• MAs: 9 / 21 (Fast), 50 / 100 (Slow)
• RSI: 14 periods | Overbought: 60 | Oversold: 40
• MACD: 12 / 26 | Signal: 9
Swing
• MAs: 10 / 20 (Fast), 50 / 200 (Slow)
• RSI: 14 periods | Overbought: 65 | Oversold: 35
• MACD: 12 / 26 | Signal: 9
Manual
• Full custom control over all indicator settings.
🛠️ All settings can be customized manually from the options panel, including the exact MA periods, RSI thresholds, and MACD structure.
🧠 How It Works:
For each timeframe, the script evaluates:
MA crossover status (two levels):
The first symbol refers to the crossover of the fast MAs
The second symbol refers to the crossover of the slow MAs
🟢 = Bullish crossover
🔴 = Bearish crossover
➖ = Flat or no clear signal
RSI Direction:
↑ = RSI above upper threshold (potential overbought)
↓ = RSI below lower threshold (potential oversold)
→ = RSI in neutral range
MACD Line vs Signal Line:
↑ = MACD line is above signal line (bullish)
↓ = MACD line is below signal line (bearish)
→ = Flat or neutral signal
Each signal is assigned a numerical score. These are aggregated per timeframe to compute a combined score that reflects the directional bias for that specific time window.
🧠 Adaptive Logic by Asset:
This script is designed to be universally compatible across all asset types — including forex, crypto, stocks, indices, and commodities.
Thanks to its multi-timeframe nature and flexible indicator presets, the script automatically adjusts its behavior based on the asset selected, ensuring relevant analysis without requiring manual recalibration.
🧾 Summary Table Output:
At the bottom of the dashboard, a combined sentiment is displayed for:
3TF → 5m, 15m, 30m
4TF → Adds 1h
5TF → Adds 4h
Each row shows:
Signal → LONG / SHORT / NEUTRAL
Confidence (%) → Based on score aggregation and signal consistency
📌 Customization Options:
Table Position: Left, Right, or Center
Text Size: Small, Normal, or Large
Full Manual Configuration: All MA, RSI, and MACD parameters can be adjusted as needed
⚠️ Disclaimer:
This script is for educational and analytical purposes only.
It does not constitute financial advice or guarantee any trading results.
Always do your own research and apply responsible risk management.

RSI Horizontal resistance levelsRSI Horizontal Resistance Levels
Purpose
This study automatically draws horizontal price rays every time the Relative Strength Index (RSI) trades inside a user‑defined band (default = 50 ± 1). The idea is to spotlight price levels that historically coincided with a specific RSI state—levels that often evolve into short‑term support or resistance as sentiment repeats.
How it works
Raw RSI – The script computes an un‑smoothed RSI of the closing price (rsiLength, default = 3).
Trigger zone – Whenever RSI falls within level ± tolerance (e.g., 49 – 51) the close price of that bar becomes a reference.
Horizontal ray – A ray (extend.right) is drawn from that close and continues indefinitely to the right, creating a live price level.
History management – Only the most recent N rays are kept (maxRays, default = 5); the oldest line is deleted automatically to avoid chart clutter.
Inputs
Name Default Description
RSI Length 3 Look‑back of the RSI calculation.
RSI Level 50 Center of the trigger zone. Common alternatives: 30, 70, custom mid‑lines.
Tolerance 1 Width of the RSI band on each side of RSI Level (set 0 for an exact hit).
Max Rays 5 Maximum number of active horizontal levels kept on screen.
Ray Color Yellow Visual color of the rays.
Ray Width 2 Thickness of the rays.
How to use it
Spot recurring reaction zones – Markets often hesitate near prices where momentum has flipped before. The rays reveal those spots automatically.
Combine with candlestick or volume cues – A level marked by this script plus a rejection wick, volume spike, or divergence can strengthen conviction.
Adapt the band –
50 ± tolerance → momentum balance line (trend pullbacks)
70 ± tolerance → overbought fade levels
30 ± tolerance → oversold bounce levels
Works on any asset or timeframe; shorter RSI periods highlight intraday rotations, longer periods capture swing pivots.
Tips & cautions
A drawn line is not a guarantee of future reversal—always validate with price action and risk management.
For high‑frequency strategies, consider lowering tolerance or increasing rsiLength to reduce noise.
You can add custom alerts on RSI crossing the band to receive push or email notifications.
Happy trading!
